The replay’s time rail.
Warnings sit in lanes above the line and tornadoes in their EF colors below it, each by its recorded times.
Press play, drag through the day, or step from one event to the next.

A storm map for roofers, built on official weather records and county parcel data.
Major storms in the area from the last five years of official records, plus recent severe weather, refreshed about every hour.
Pick a tornado outbreak and press play: the warnings and the tornadoes play back by their recorded times.
For a surveyed tornado, it counts the homes in the path, zone by zone, and colors each home by the zone it’s in.
Zone labels use the source’s own words.
For a hurricane, it counts the homes in the strongest winds that reached homes.
Recent days show warned areas, radar hail estimates and storm reports, each labeled for what it is.
Upload your customer list, and it shows which of your customers live there.
The list is held for the session only and wiped when the session ends.
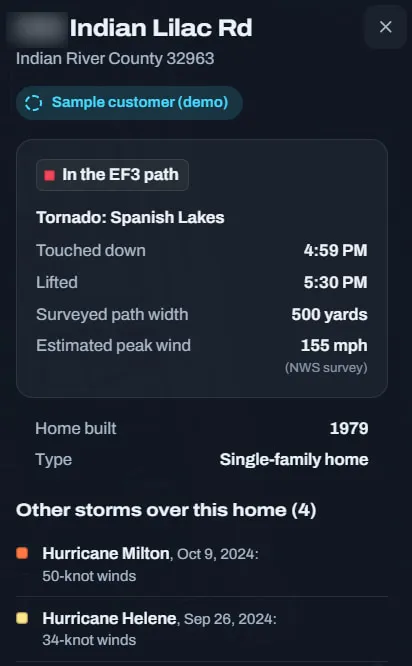
Click a home to see its address, the zone it’s in, and the other storms over it.
Want to see your own customers on it?I’ll set your company name and phone before the call.
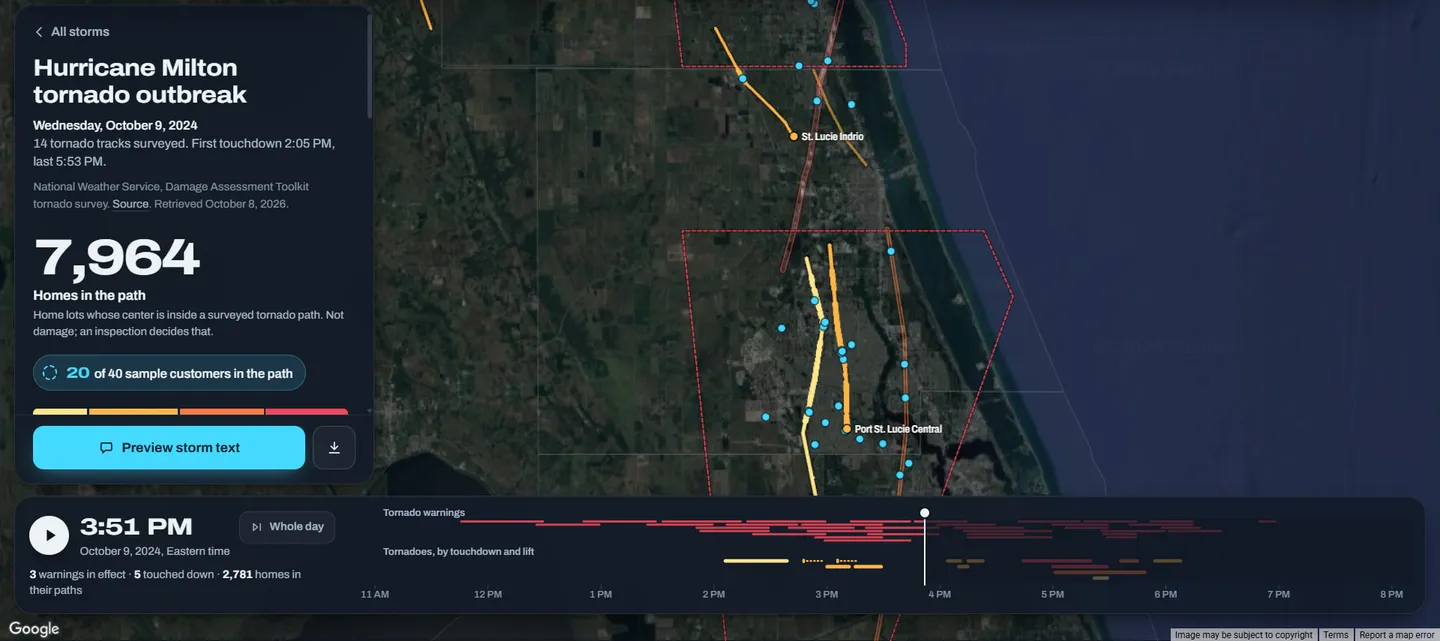

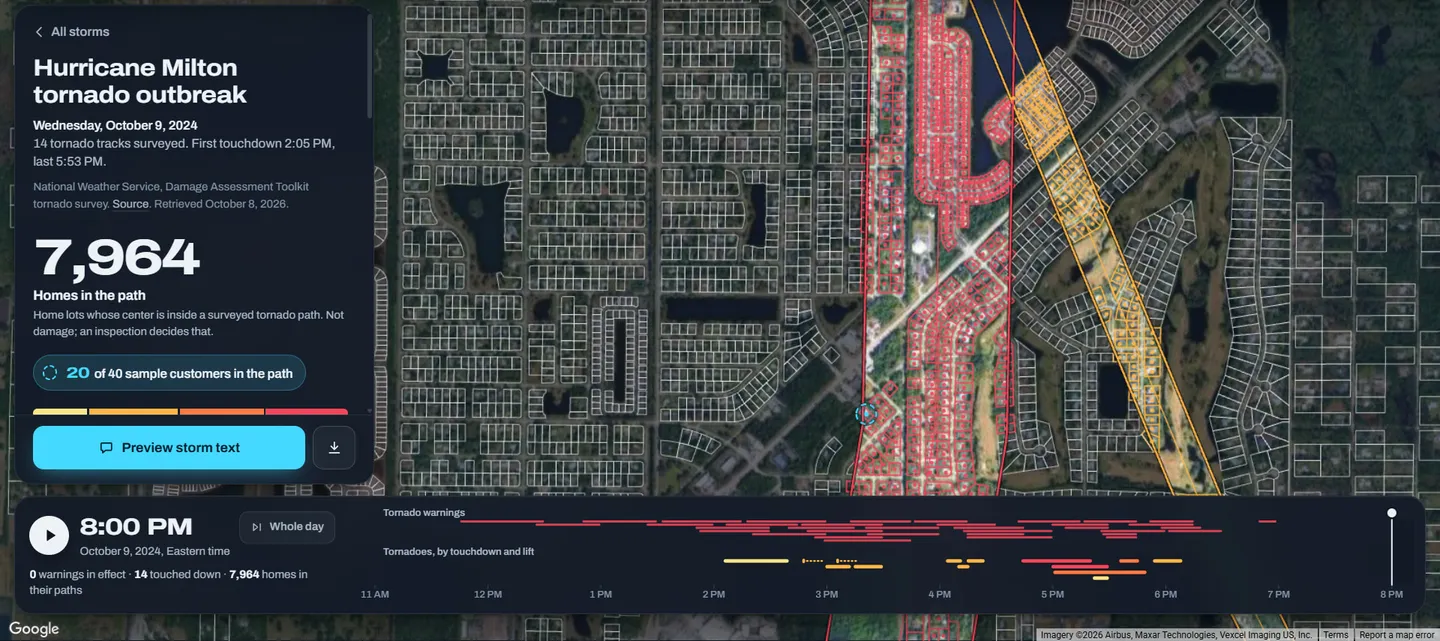
Warnings sit in lanes above the line and tornadoes in their EF colors below it, each by its recorded times.
Press play, drag through the day, or step from one event to the next.

Type in your average job value, and it does the math.
It stays blank until you do.

Every storm shows its source, product and date, with a link.

Until you upload a list, sample homes stand in for your customers, and they’re always labeled as samples.

The same map and replay work on a phone.
Every storm, and every count of homes in it, traces to an official source.
Uploaded addresses are matched to the county parcel addresses first, then to the US Census Bureau’s geocoder.
It never stores owner names, and an uploaded customer list is never saved.
Axis Storm is a storm map for roofers.
It maps each storm from official weather sources, marks the homes in each of its zones, and shows which of your customers live there.
Official records: the National Weather Service’s tornado surveys, warnings and storm reports; the National Hurricane Center’s wind areas; NOAA radar hail estimates; and the county parcel records.
Each storm links to its source.
Brevard, Indian River, St. Lucie and Martin counties.
If you work other counties, tell me which ones on the call.
Recent storms update about every hour.
The major storms come from the last five years of official records.
No. It’s held for the session only, and it’s wiped when the session ends, after two hours at most, or when it’s cleared.
You don’t have to upload it: sample homes show by default.
It’s the homes inside a surveyed tornado path.
For a hurricane, the count is the homes in the strongest winds that reached homes, and a recent day counts the homes in warned areas or under the radar hail estimate.
No. Condos are left out, because the roof belongs to the association.
It counts single-family homes, mobile homes, and duplexes or small multifamily buildings.
On a screen share.
Before the call, I set your company name and phone, and you can bring your customer list as a spreadsheet, or I’ll use sample homes.
Book a time. Bring your customer list as a spreadsheet, or I’ll use sample homes.
For your website: .